HELP & TUTORIALSHOME
IWQIS is designed using latest web technologies, and is tested on all major browsers. Please use the latest version of your web browser. IWQIS provides a better user experience on the Google Chrome web browser with higher screen resolutions.
FREQUENTLY ASKED QUESTIONS
-
What data do the sensors gather?
The water quality sensor network is a statewide collaboration between the United States Geological Survey (maintaining 15 real-time water-quality stations) and IIHR—Hydroscience & Engineering, a research institute at the University of Iowa (maintaining 22 real-time water-quality stations). Sensors are deployed in the spring and brought in from the field each fall for maintenance to prevent damage from river ice. Data may include Nitrate (NO3-N) + Nitrite (NO2-N), Chlorophyll-A, Dissolved Oxygen, pH, Specific Conductance, Temperature and Turbidity depending on the site location.
-
Does that information vary from sensor to sensor? Some sensors might have different information?
Yes, data may include Nitrate (NO3-N) + Nitrite (NO2-N), Chlorophyll-A, Dissolved Oxygen, pH, Specific Conductance, Temperature and Turbidity depending on the site location.
-
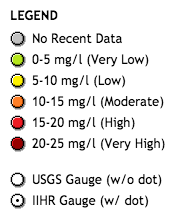
Is dark red different than the light red?
Yes, the color indicates a range of Nitrate (NO3-N) + Nitrite (NO2-N) concentration.
-
What is the EPA limit for nitrates?
The maximum contaminant level (MCL) in drinking water as nitrate (NO3) is 45 mg/l, whereas the MCL as NO3-N is 10 mg/l. The MCL is the highest level of NO3 or NO3-N that is allowable in public drinking water supplies by the U.S. Environmental Protection Agency (EPA)
-
If a dot is dark red, does that indicate the water is dangerous to drink?
Nutrient pollution in ground water can be harmful if used as a drinking water source.
-
How do I tell the difference between IIHR sensors and USGS sensors?
The circle sensor markers that contain a black center dot are USGS sensors
 while those without the dot are IIHR—Hydroscience & Engineering sensors
-
Why are some of the dots gray?
Gray dots indicate that there is no recent data for this site.
-
Can I see information about where the sensors are, the drainage area, etc?
The watershed area is highlighted when you click on the circle sensor marker.
-
How do I access graphs for water quality data?
Click on a circle water quality sensor marker. A graph for Recent Nitrate (NO3-N) + Nitrite (NO2-N) data is shown in the upper left corner of the screen [SCREEN SHOT]. Click on More Data to access the other available recent data parameters. For data beyond the 15-day window please contact Chris Jones.
-
How is water quality data used?
Water quality data is used to assess the condition of Iowa streams, quantify the effectiveness of conservation practices, and track progress toward water quality improvement goals.
-
What can be done to mitigate the nutrient pollution?
Refer to the Toolkit of Resources published by the EPA.
-
Does IWQIS work on all web browsers?
IWQIS is designed using the latest web technologies, and is tested on all major browsers. Please use the latest version of your web browser. IWQIS provides a better user experience on the Google Chrome web browser with higher screen resolutions.
-
Who should I contact if IWQIS functions do not work properly on my computer?
Use our feedback form to provide details of the problem (how to repeat the error, what you see [and expect to see] during the error) and your browser information (browser name, version, operating system, etc.).
-
Can I suggest a new function or a new data source (USGS stream gauge, etc.)?
Yes please contact us using our feedback form with your suggestions.